# Turn Claude/Cursor into a
data science workbench.
dante-ds is a Python library and MCP server for Agentic Data Science.
Agents write SQL, integrate your company's style, and have tailored behavior.
// what_dante_is
dante-ds is a free, open-source
Python library. You pip install it,
point it at your data sources, and it learns the
validated SQL behind your existing dashboards. Each
query gets paired with a plain-language description
of what it answers. These pairs become
embeddings: a searchable knowledge
base of your team's actual work.
It also generates a rules library that encodes your conventions: which tables to use, which filters to apply, which definitions changed and when. Presentation standards so your charts and decks look amazing everytime.
dante-ds registers as an MCP server for Claude Code, so when you ask a question, Claude searches your embeddings and reads your rules before writing a single line of SQL
// what_dante_solves
Inaccurate SQL and inconsistent agents.
Documentation goes stale. Semantic layers need governance committees. Dante works the other way: semantics are discovered agentically and every query you write teaches the system something. Every correction becomes a data point. The AI's understanding of your data compounds, because the work itself is the input.
// dante_features
Everything Claude/Cursor needs to be your data science co-pilot.
Automated Context Curation
Leverage your company's existing charts and dashboards to create a semantic library of SQL Queries your tool can leverage to write perfect SQL, the first time.
Consistent Agentic Behavior
Perfect presentations using your brand's colors and fonts, distinct personalities tailored to data science, and custom agentic tool use for every project.
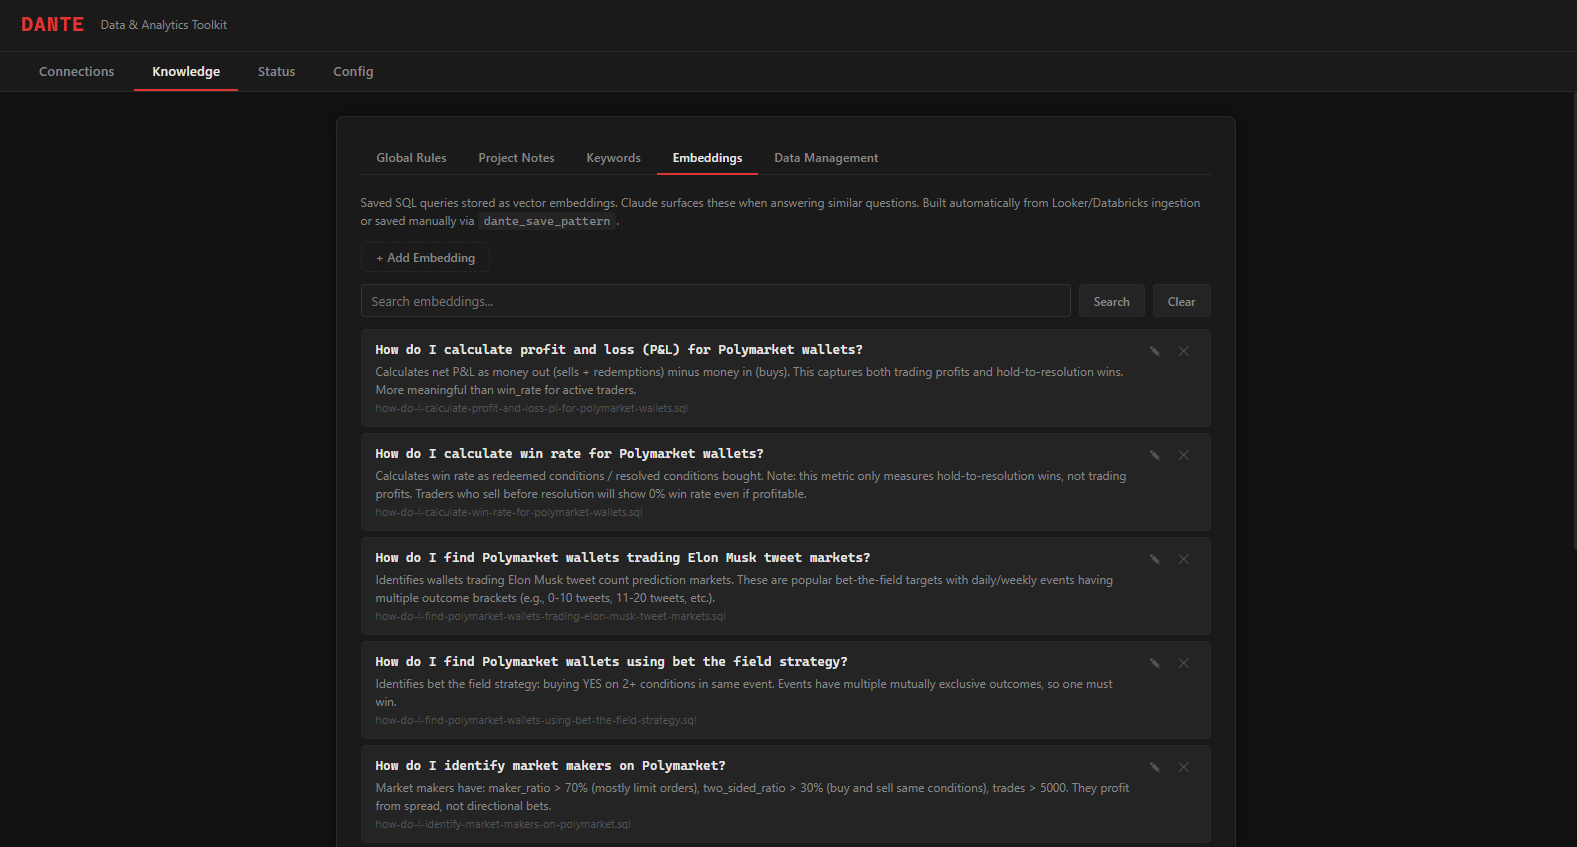
Beautiful UI
Dante-DS comes equipped with a beautiful UI to manage your knowledge library through easy visual interaction.
MCP Server
Runs as a Model Context Protocol server. Claude Code discovers database tools automatically, with no prompt engineering required.
// how_it_works
Three steps from zero to querying your production database inside Claude Code with your data science team's knowledge powering it.
Install the package
Pick your database extras: pip install dante-ds[postgres,snowflake]
Create your context
Fill in your connection settings and tell dante-ds to create your first embeddings library
Start asking questions
"What were our top 10 customers by revenue last quarter?" Claude writes the SQL, runs it, and returns the results.
// quick_start
Install, configure, and start querying.
    # core package
    $ pip install dante-ds

    # getting started
    $ dante launch # Opens UI, visual setup
    $ claude # Launch Claude
    claude How many MAU do we have? # Done.
// supported_databases
Install only the drivers you need. Each database is an optional extra.
// resources
Deep dives into how Dante works and why it's built this way.
Data science at the speed of thought.
Stop context-switching between your editor and a SQL client. Let Claude handle the queries.