Getting Started with Dante
From install to your first AI-powered query in six steps. This guide walks through setting up Dante with a Databricks connection.
Install Dante
Dante is a Python package. Install it from PyPI and you get the CLI, the MCP server, the management UI, and the Python library.
Verify the install by checking the version.
Launch a project
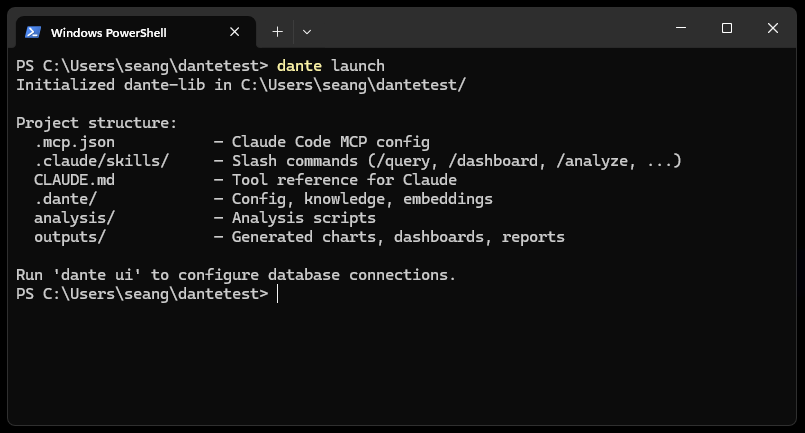
Navigate to your project directory (or create a new one) and run dante launch. This scaffolds the project structure and wires up the MCP server for Claude Code. Add --ui to also open the management UI in your browser.
$ dante launch
# or: dante launch --ui (opens the management UI immediately)
Dante creates the following structure:
.claude/skills/ # Slash commands (/query, /dashboard, ...)
CLAUDE.md # Tool reference for Claude
.dante/ # Config, knowledge, embeddings
analysis/ # Your analysis scripts
outputs/ # Generated charts, dashboards, reports
To open the management UI at any time, run dante ui (available at http://localhost:4040).
Connect to Databricks
In the management UI, click the Connections tab. This is where you configure your database connection.
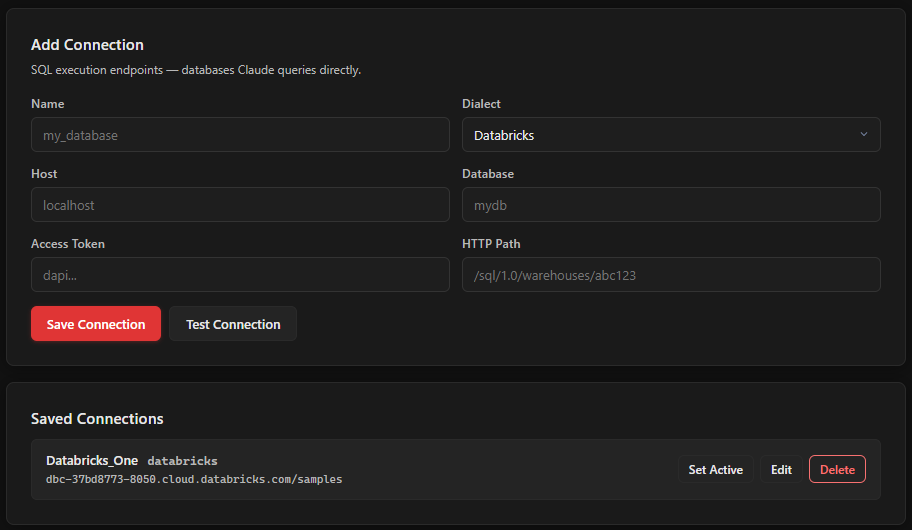
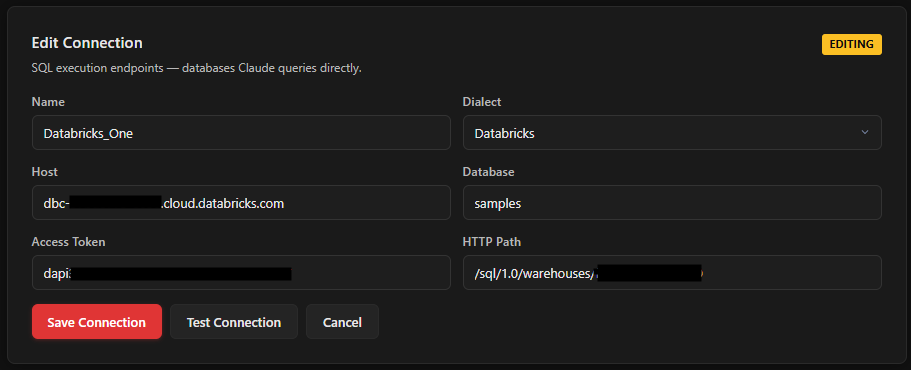
Fill in the connection form with your Databricks details:
| Field | Value | Where to find it |
|---|---|---|
| Name | A label for this connection (e.g., prod-databricks) |
Your choice |
| Dialect | Select Databricks | Dropdown |
| Host | dbc-xxxxx.cloud.databricks.com |
Your workspace URL (without https://) |
| Access Token | dapi... |
Databricks > User Settings > Developer > Access Tokens > Generate New Token |
| Database | Your catalog name | Databricks > Catalog Explorer, listed in the left sidebar |
| HTTP Path | /sql/1.0/warehouses/abc123 |
Databricks > SQL Warehouses > your warehouse > Connection Details |
Click Test Connection to verify. You should see a green success message. Then click Save Connection.
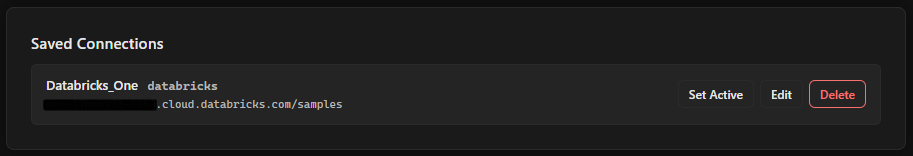
Click Set Active to make this your default connection. The active connection gets a green indicator.
Where do credentials go? Connection details are stored in ~/.dante/connections.yaml, which is gitignored. They persist across all your Dante projects.
Ingest context from your dashboards
This is where Dante gets interesting. If your organization uses Databricks SQL dashboards (or Looker, Redash, Superset), Dante can extract the SQL behind every chart and convert it into searchable embeddings. Your AI tools will be able to find and adapt proven queries instead of writing SQL from scratch.
Go to the Data Management tab. If you are ingesting from Databricks dashboards, you need to add your Databricks API credentials first.
Expand the API Credentials section at the bottom and fill in:
| Field | Value |
|---|---|
| Workspace URL | https://dbc-xxxxx.cloud.databricks.com |
| Personal Access Token | Same token from Step 3 (or a separate one) |
Click Save Credentials.
Now scroll up to Context Ingestion. Select your source from the dropdown (Databricks, Looker, Warehouse, or All). For a first run, you might want to check "Limit dashboards" and set it to 5 to test things out.
Click Generate Embeddings.
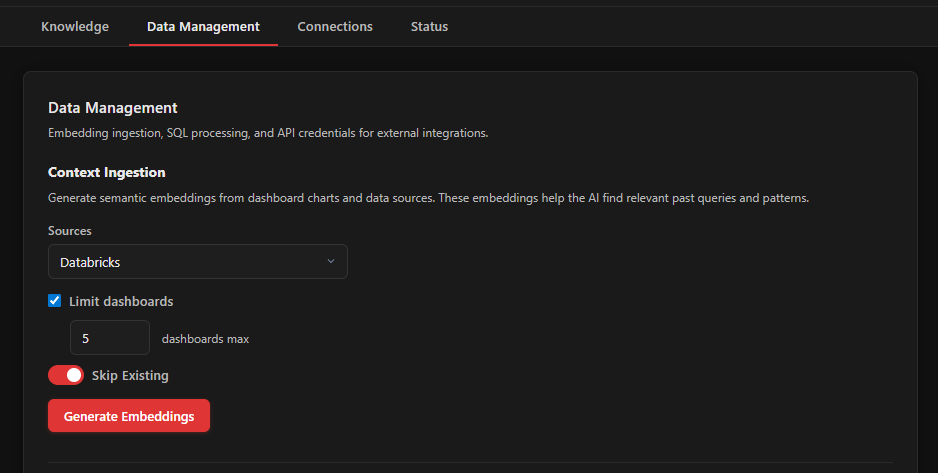
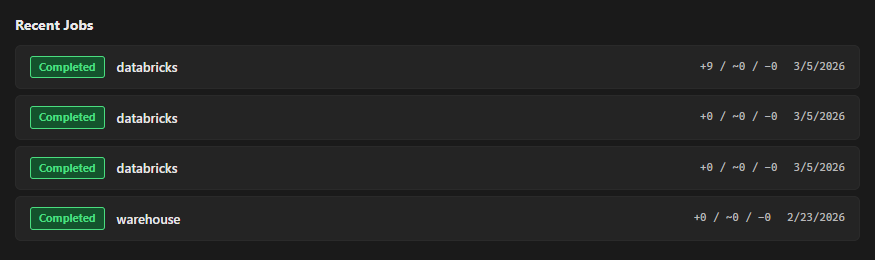
Dante will connect to your Databricks workspace, pull dashboard definitions, extract the SQL from each chart, simplify it, and store it as a vector embedding. Progress appears in the Recent Jobs section below.
No dashboards? You can skip this step. Dante also builds context from your warehouse schema automatically when you use the dante_describe and dante_profile tools. You can also save SQL patterns manually with dante_save_pattern as you work.
View and edit your embeddings
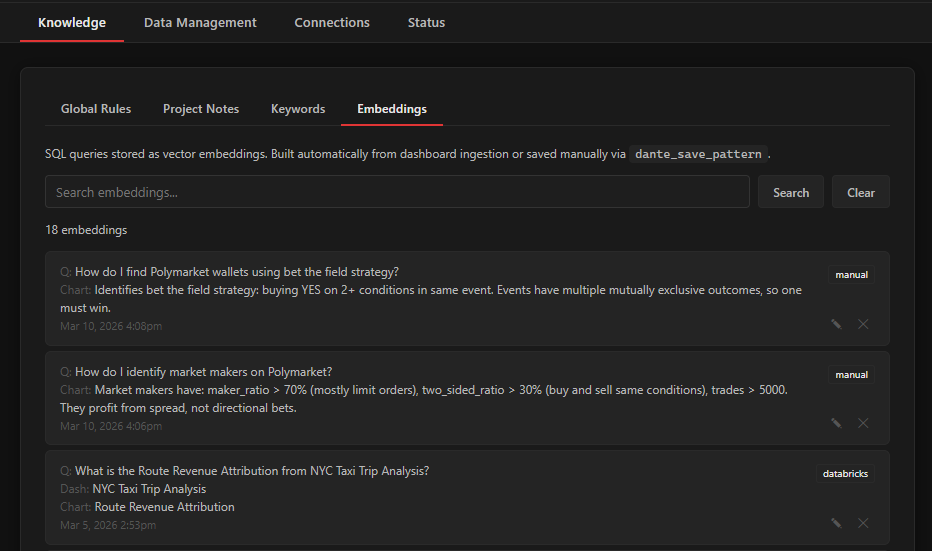
Once ingestion finishes, head to the Knowledge tab and open the Embeddings section. Every embedding Dante generated is listed here: the natural-language question, the source SQL, and which dashboard or table it came from.
You can edit any embedding's question or SQL, lock specific embeddings so they survive re-ingestion, or hide ones that are not useful. This is your chance to review what Dante extracted and refine it before you start querying.
Start asking questions
Open Claude Code (or Cursor) in your project directory. The MCP server connects automatically via the .mcp.json file that dante launch created.
Try asking a question about your data. Dante's tools are available to Claude as MCP functions. A typical interaction looks like this:
"What were our top 10 customers by revenue last quarter?"
# Behind the scenes, Claude will:
# 1. Call dante_search to find relevant SQL patterns
# 2. Call dante_describe on the relevant tables
# 3. Write and execute SQL via dante_sql
# 4. Optionally visualize with dante_chart
The more context Dante has (from ingestion, glossary terms, saved patterns), the better the results. Context compounds over time as you work.
Slash commands. Dante installs several slash commands for Claude Code: /query for data exploration, /dashboard for building interactive dashboards, /analyze for multi-step analysis with checkpoints, and /report for compiling results into HTML reports.
Free and open source. Works with Claude Code and Cursor.